Rapports & analyses
Daily takings, retention rates, top services, slow days — all at a glance.
See exactly what's working: daily revenue, week-over-week trends, top services, top customers, slow days, retention rate, and rebook rate. Filter by date, technician, or category. Export anything to CSV or PDF.
Reports are read-only and instant — no waiting on a "build" button. Every cent of revenue traces back to a sale, customer, and technician.
Étapes
1. Today's dashboard
Reports → Today shows takings, average ticket, services performed, top earner, and any pending sales.
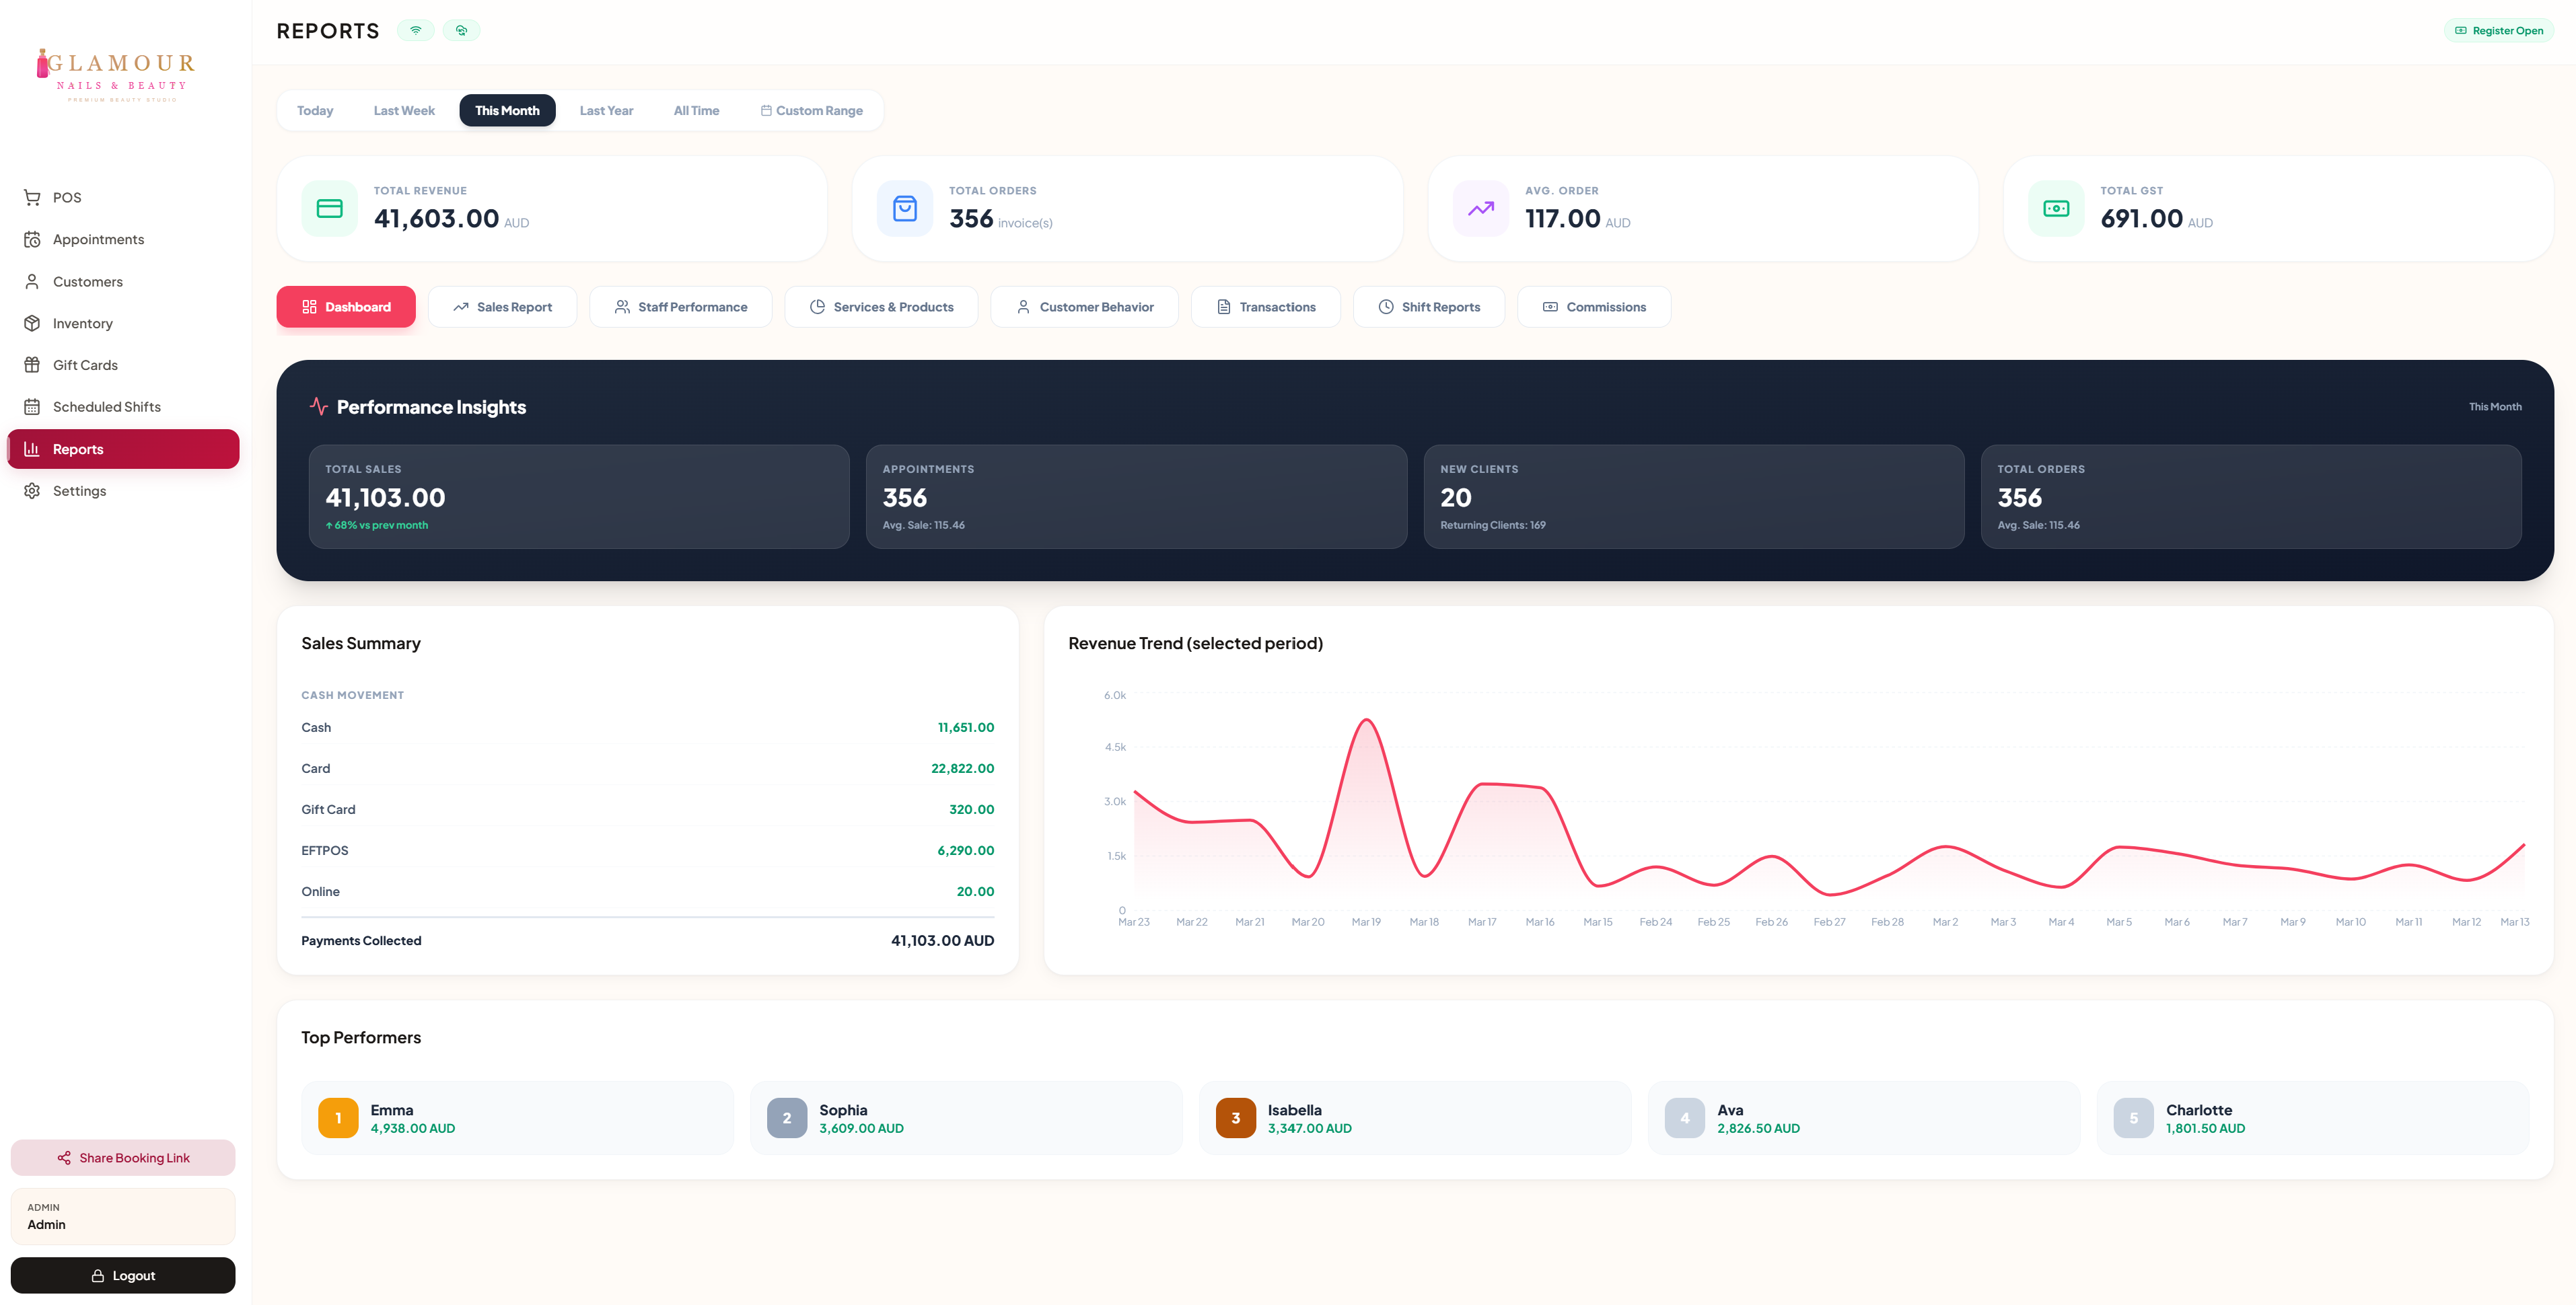
2. Period reports
Switch to Week, Month, Year, or custom range. The system adapts — week-over-week comparisons appear automatically.
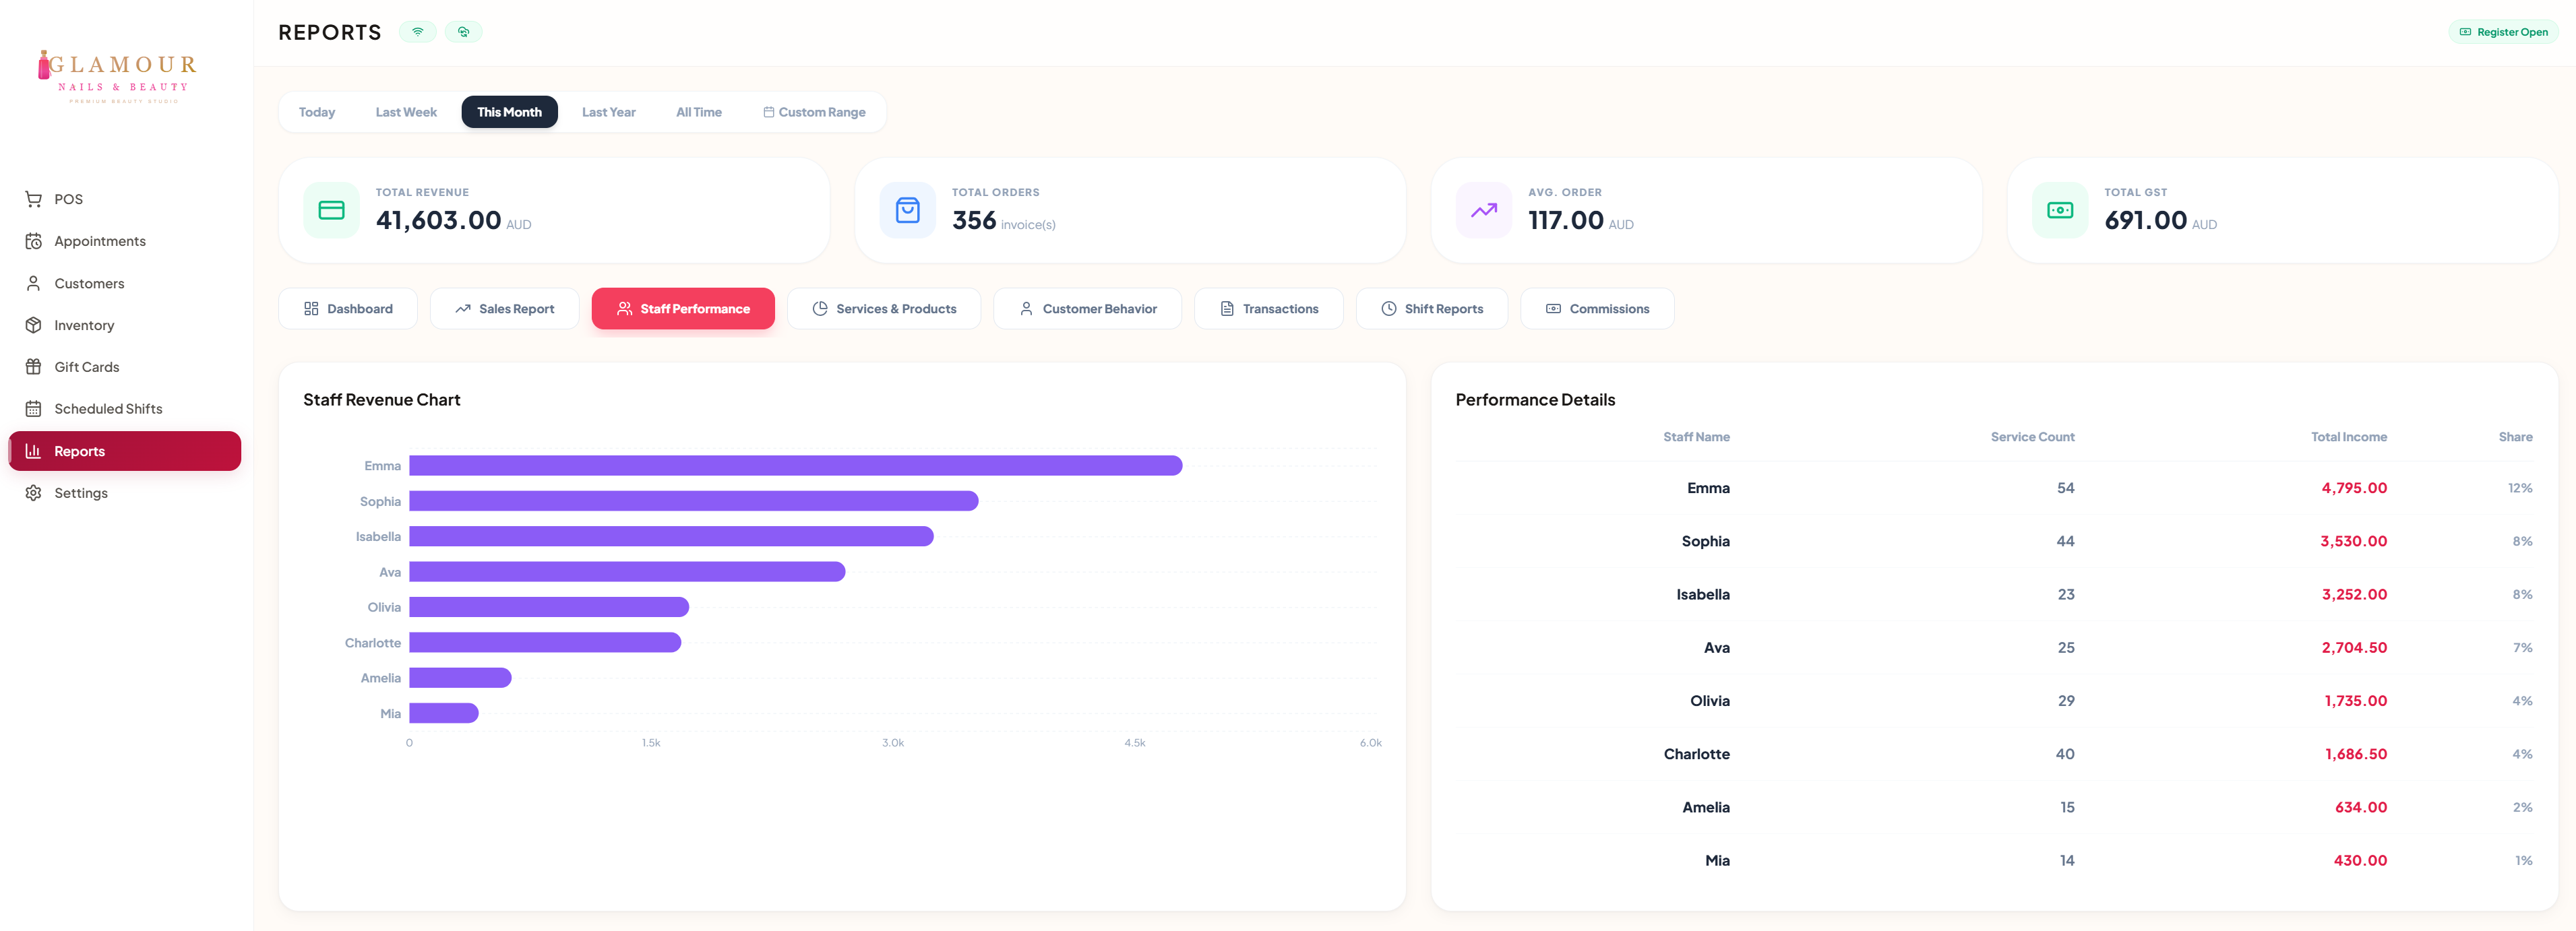
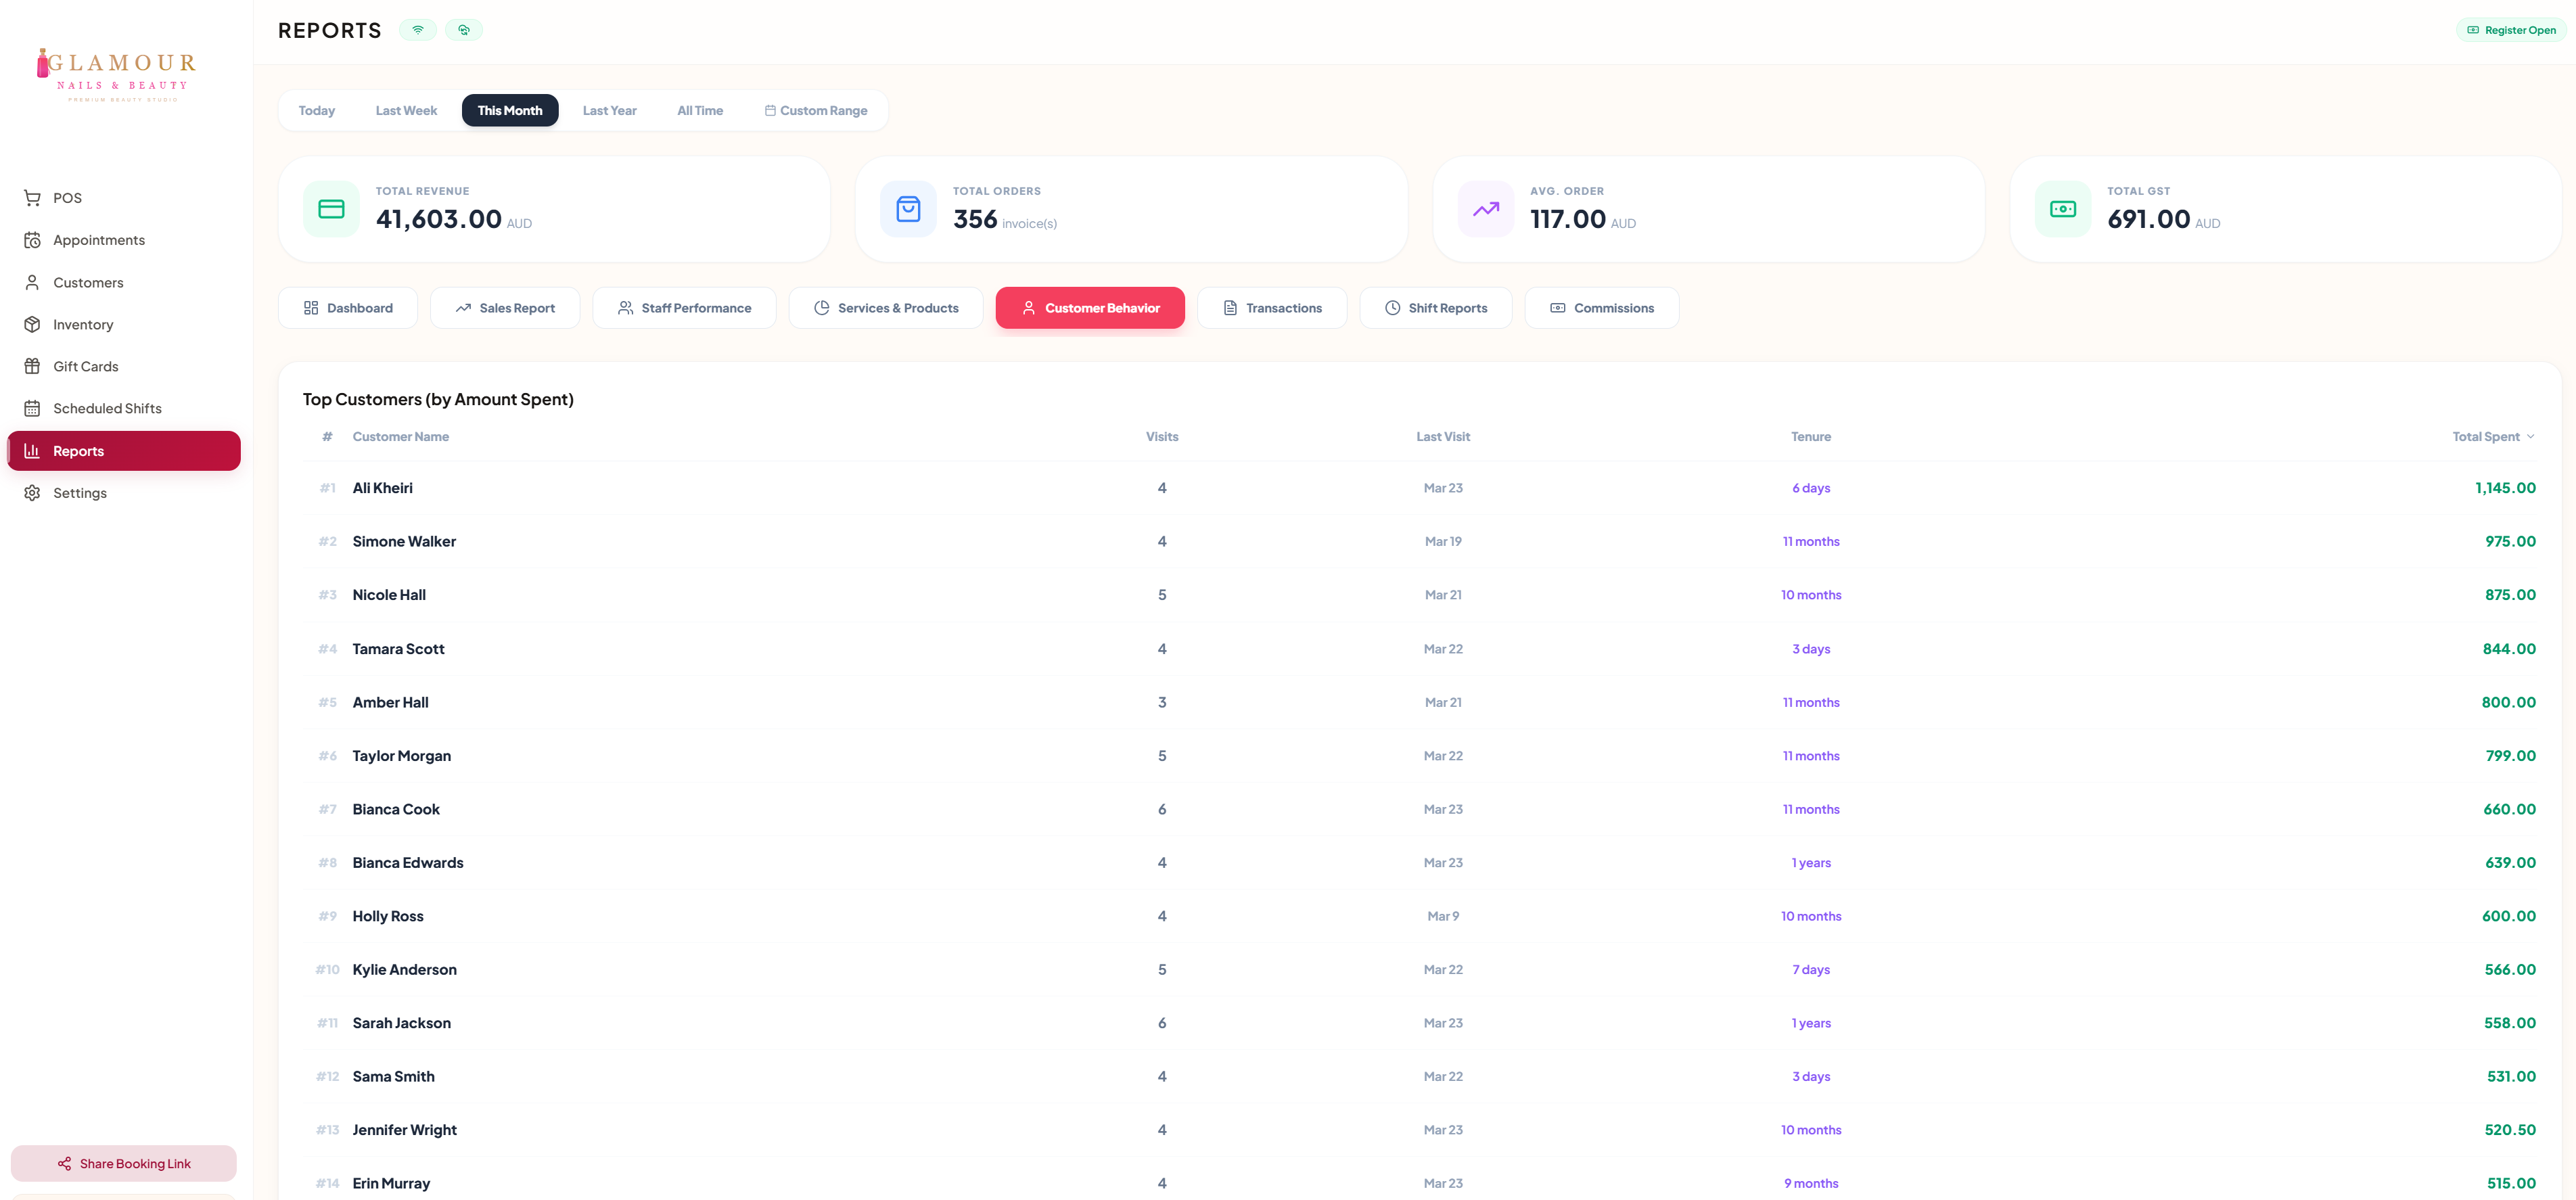
3. By technician / by service / by customer
Drill into who or what is driving (or hurting) revenue. Retention shows how many of last month's customers came back.
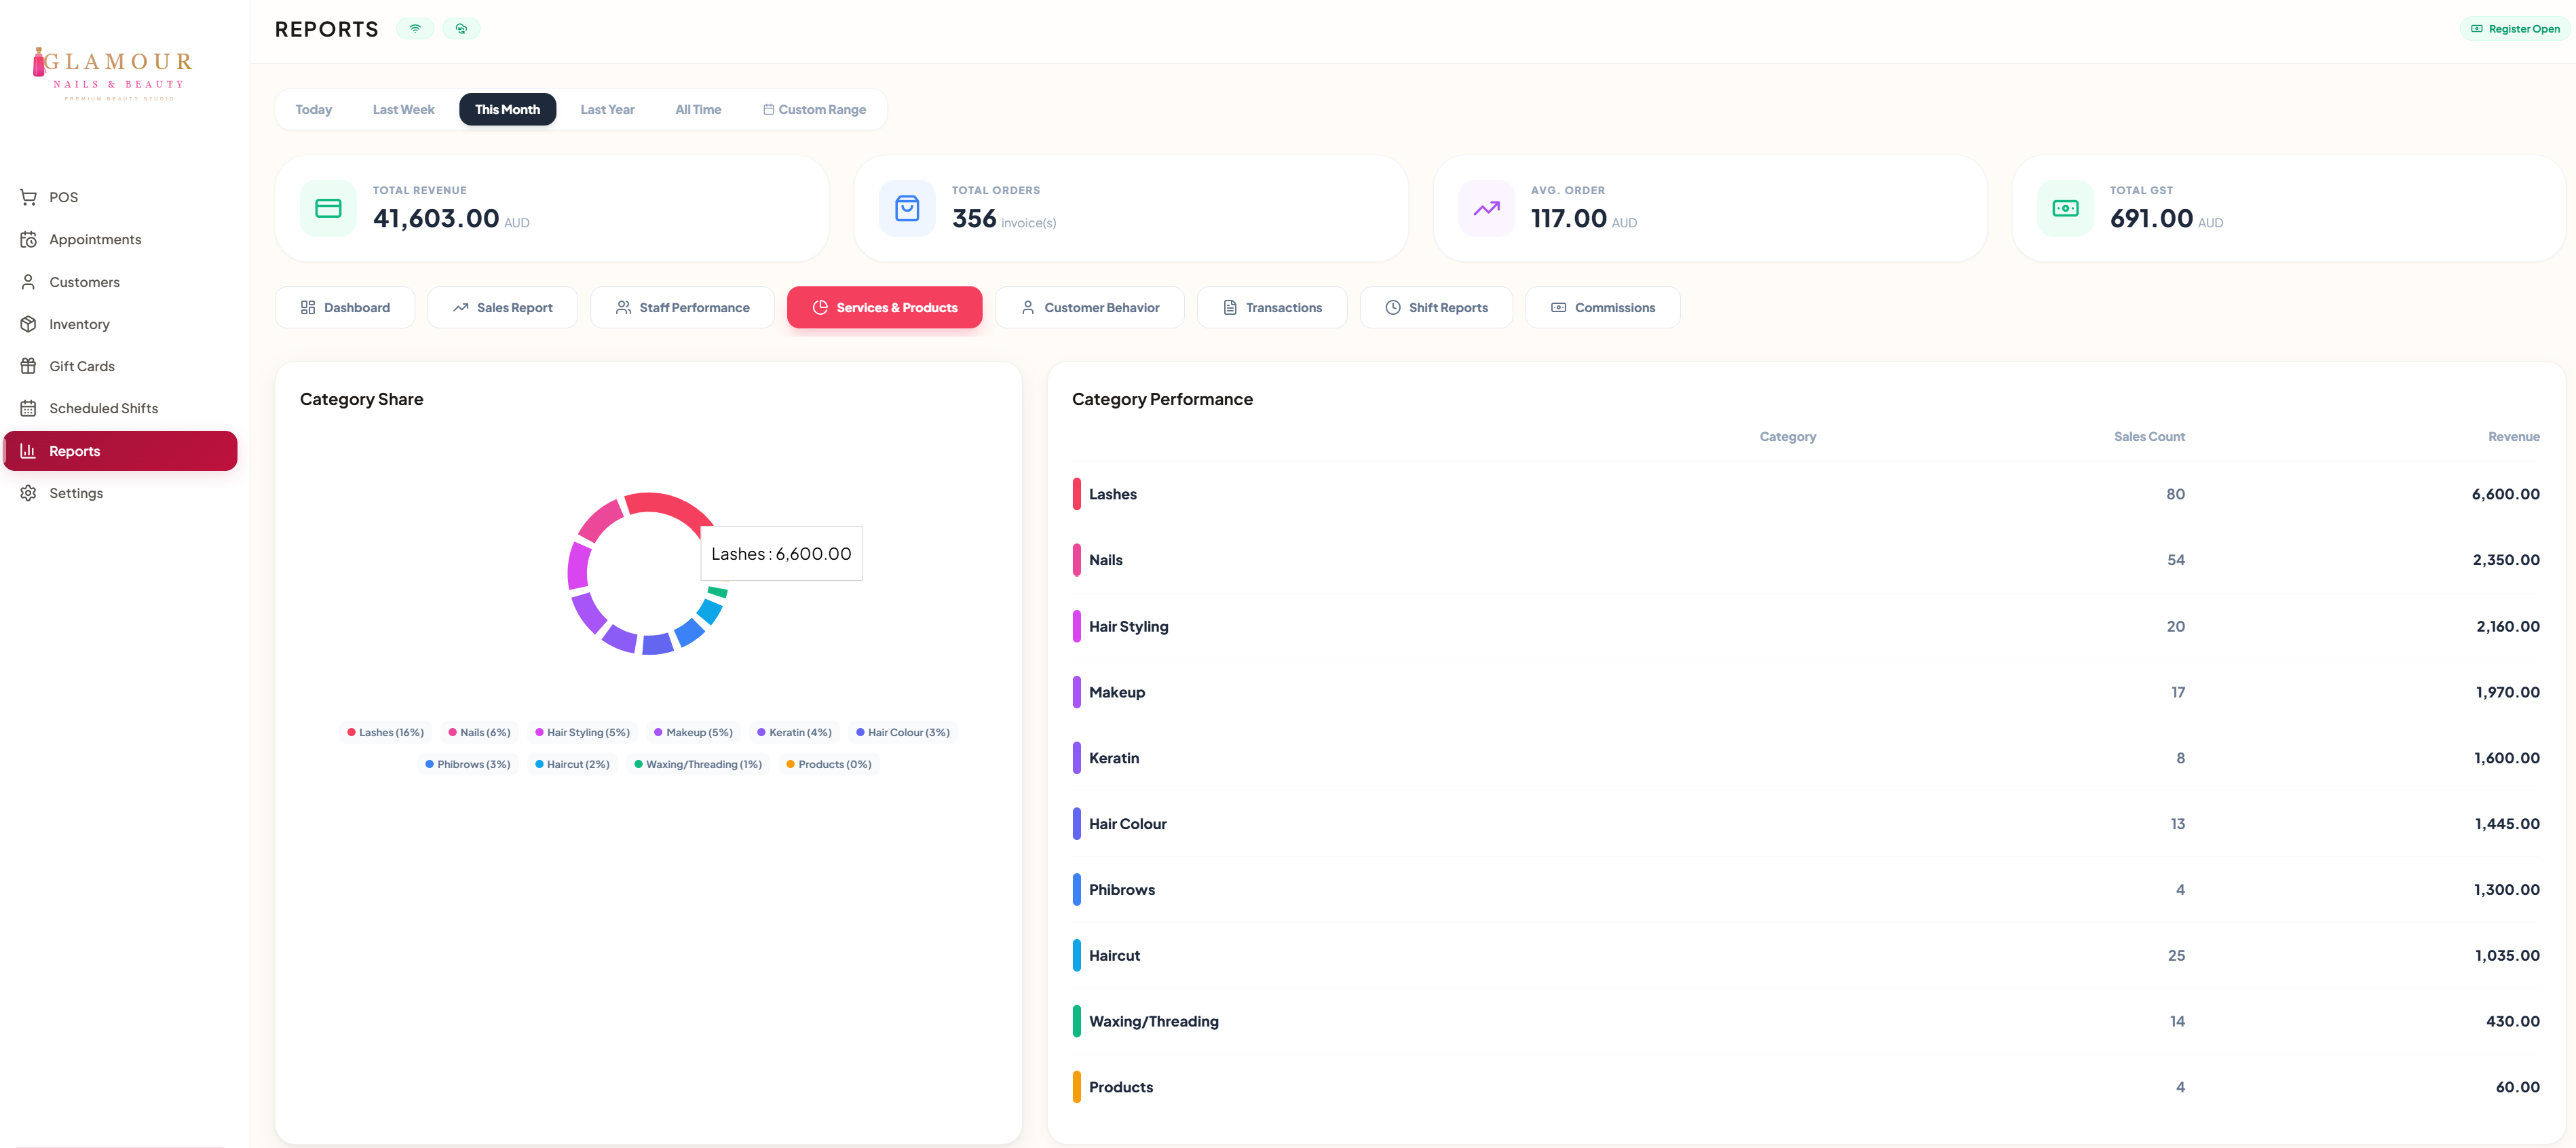
4. Top services and products
See which services and retail items earn the most each period.
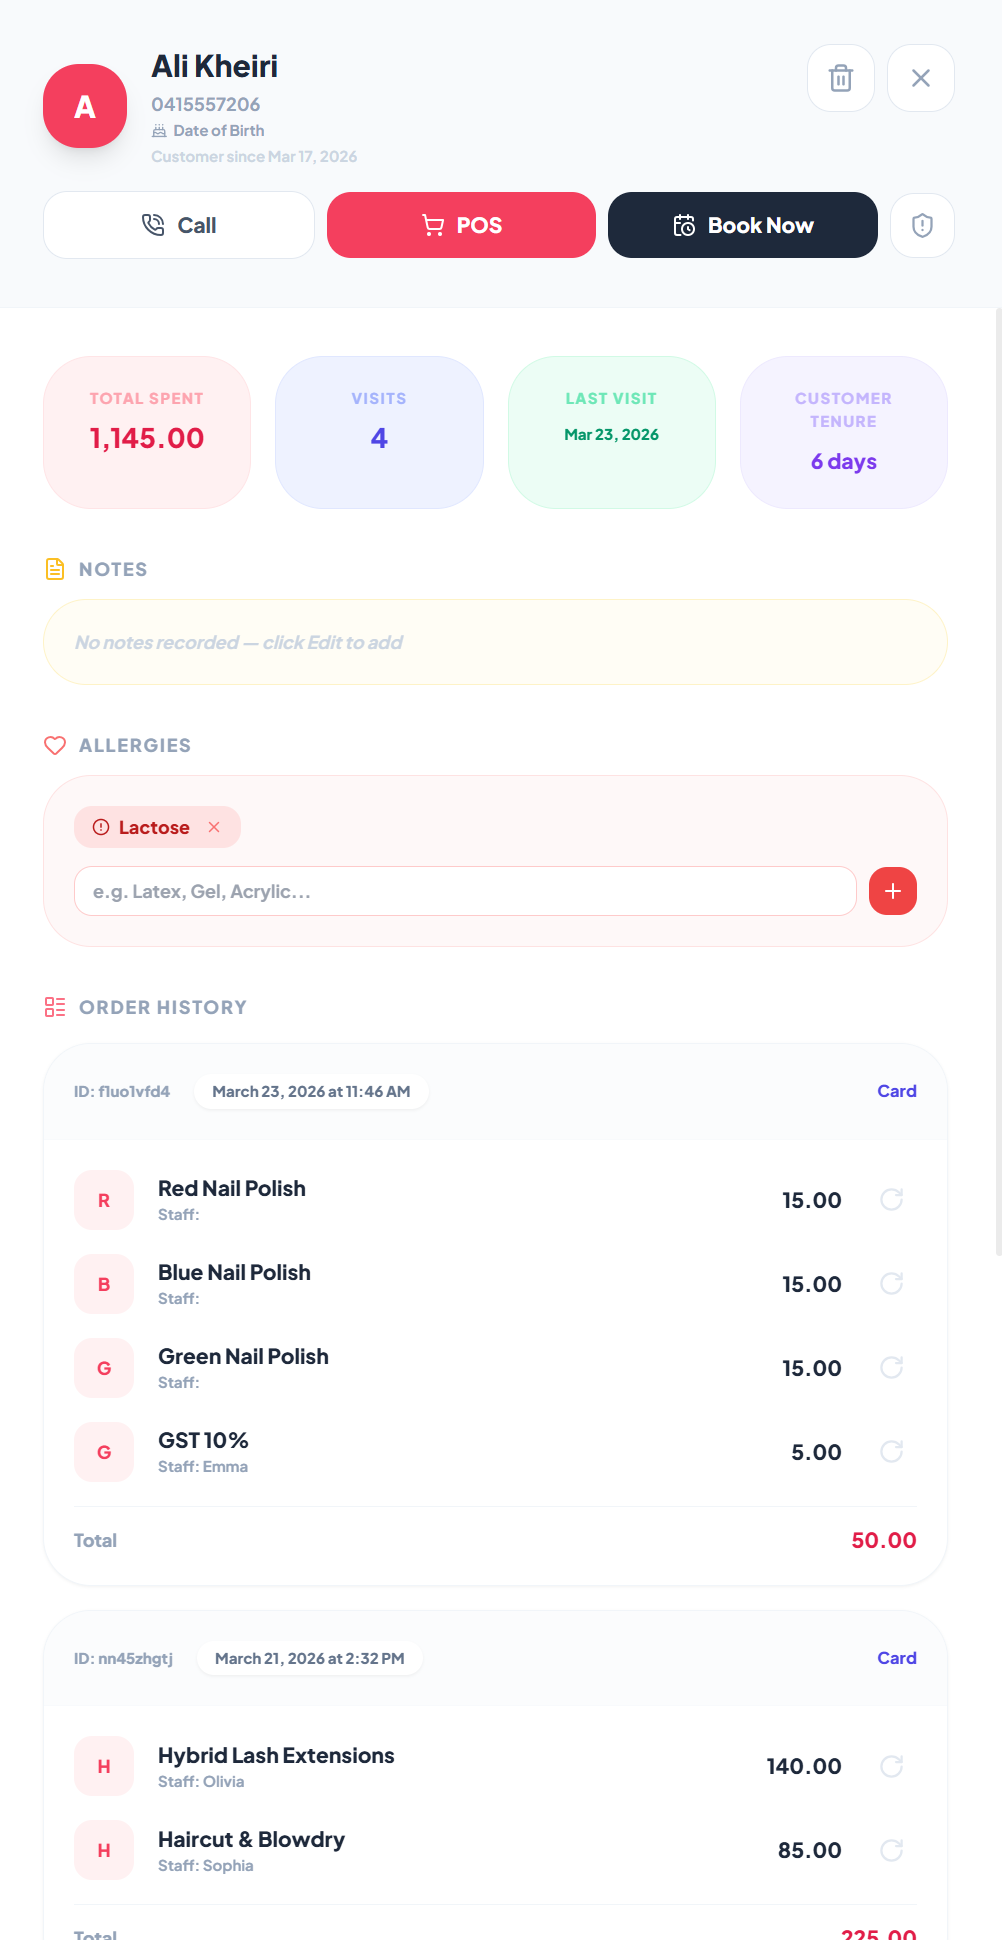
5. Customer retention
Track first-time vs. returning customers and how many come back month over month.
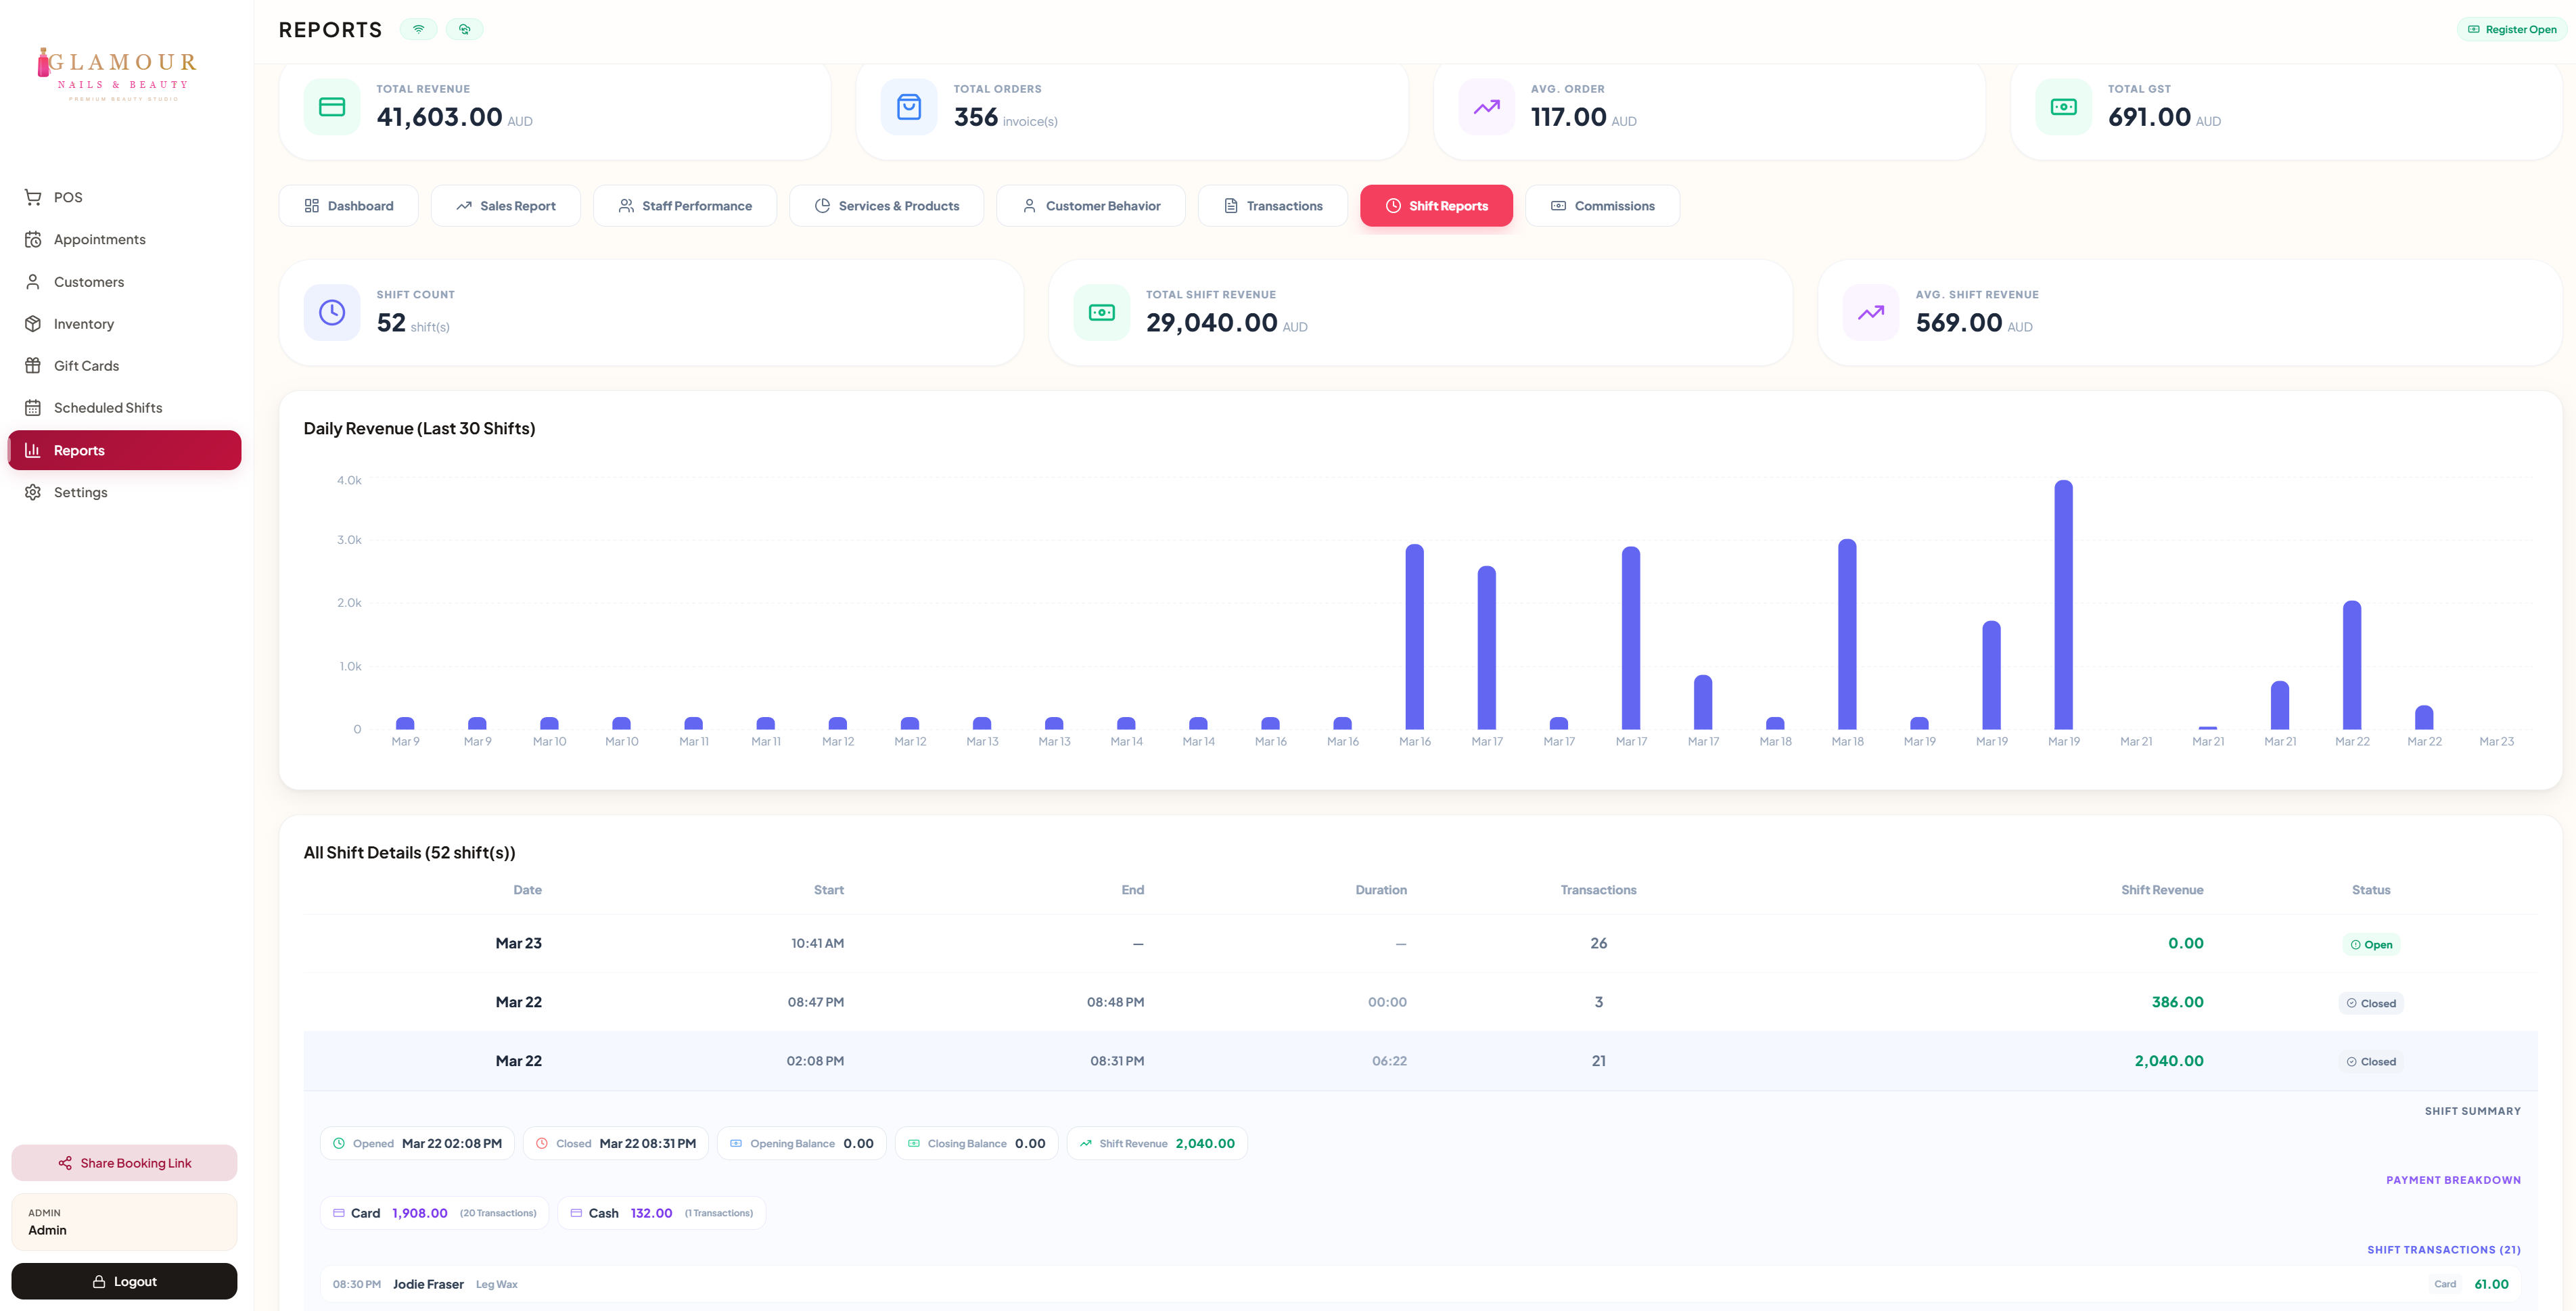
6. Hourly heatmap
Spot your busy hours and quiet days at a glance to plan staffing and promotions.
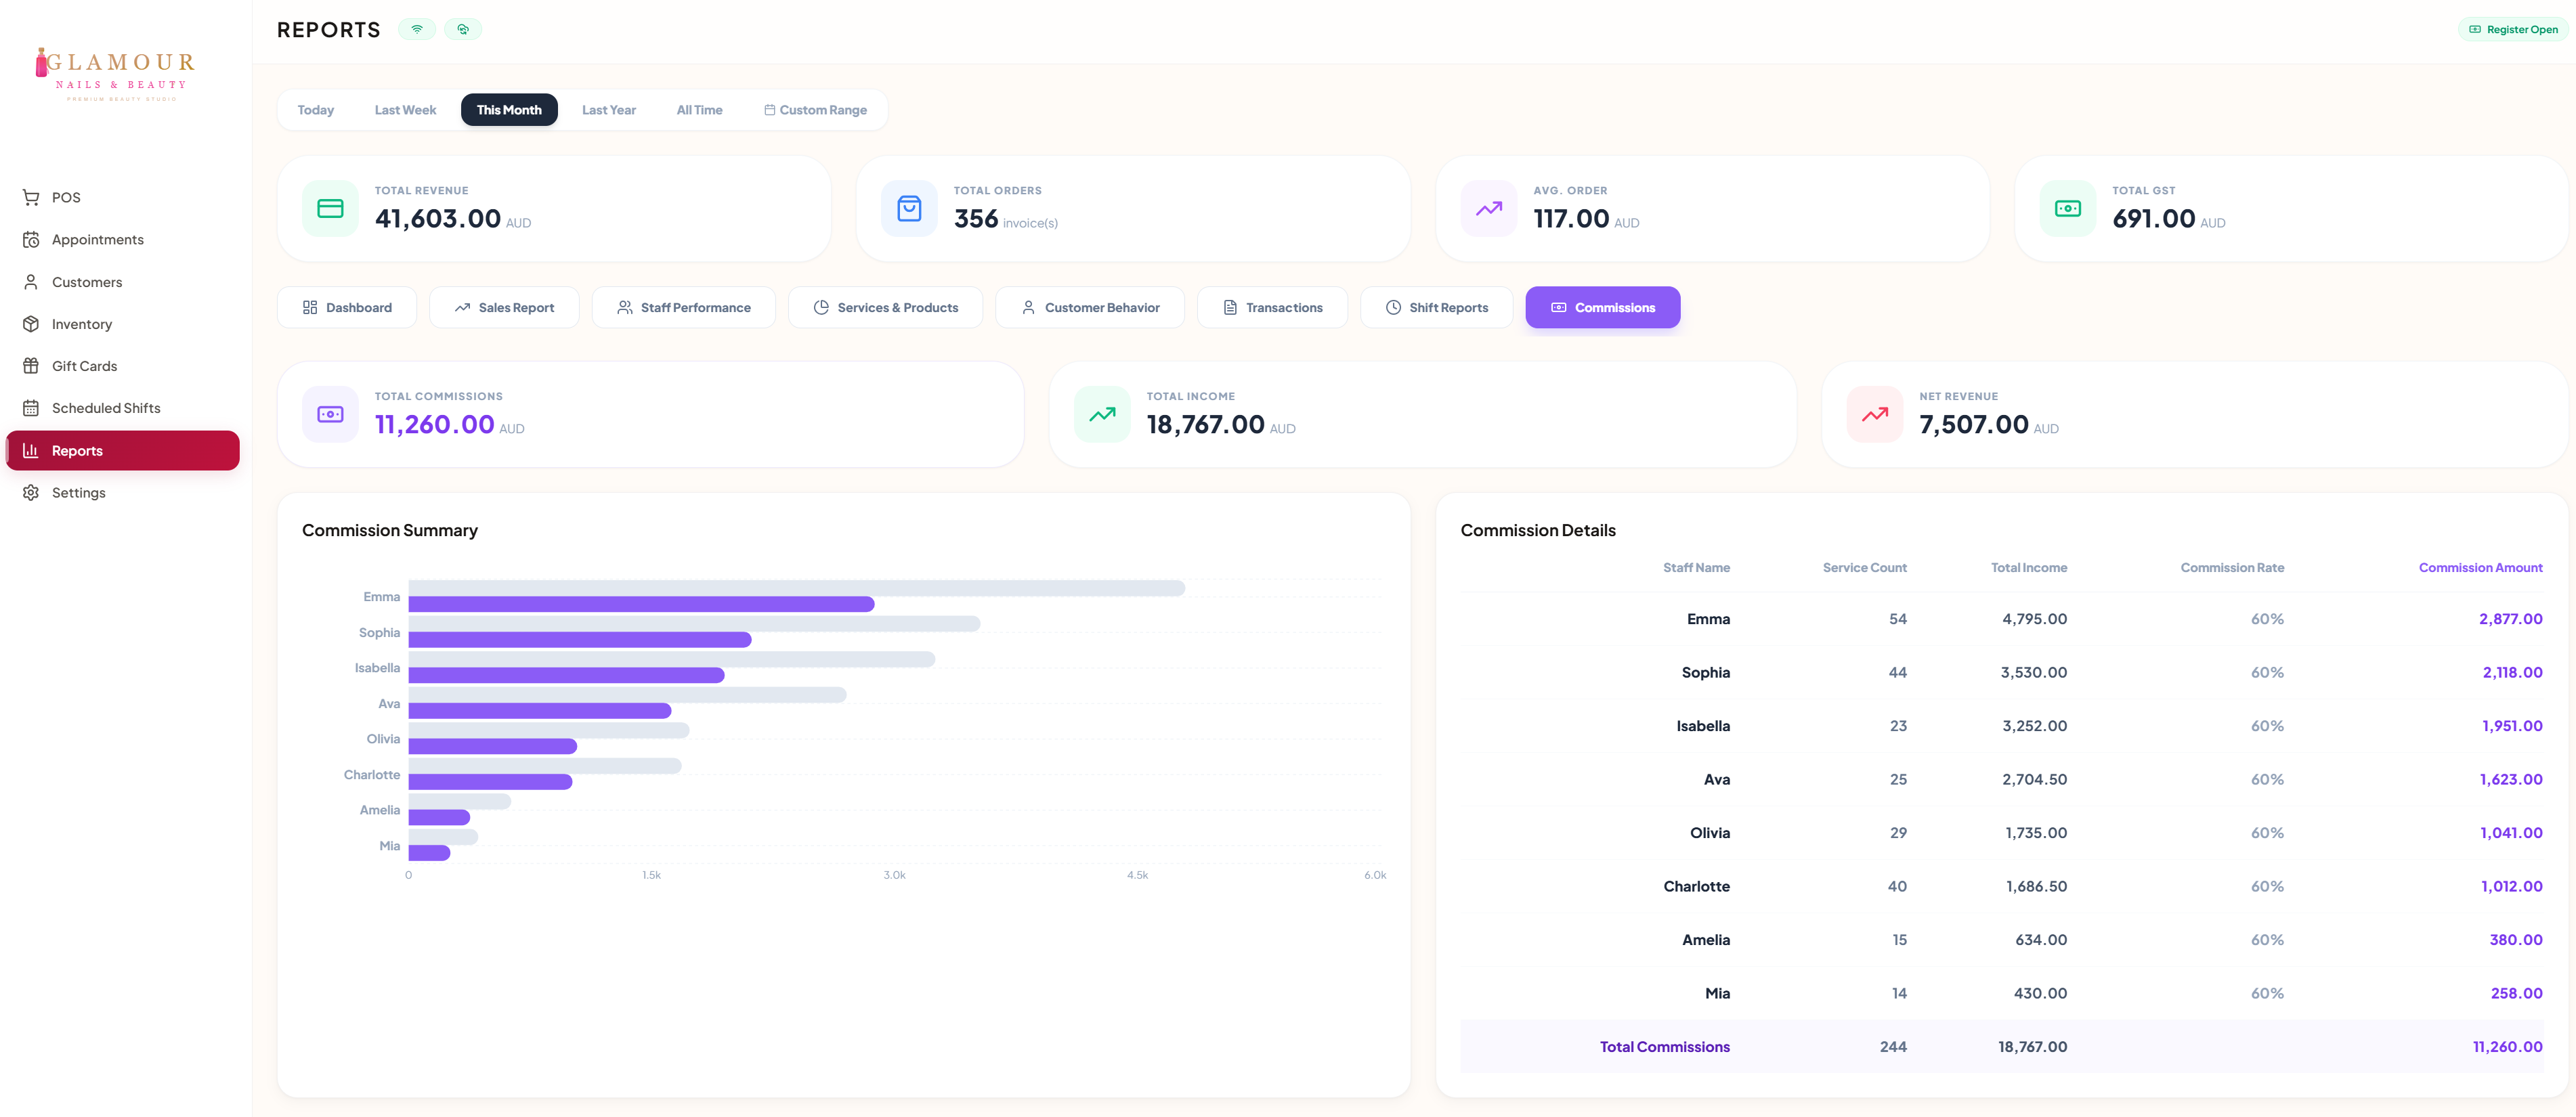
7. By Staff Member
Pick one staff member and a period: service count, revenue, average per service and clients served, a breakdown by service with count, revenue and share, and every service line sold with date, client and amount. Refunded lines are listed but not counted. Export CSV downloads the lines.
8. Export
Every report has Export → CSV (for Excel) or PDF (for accountant/landlord). Schedule a weekly email under Reports → Schedules.